Nifty Rounded Corners - Using Javascript and CSS. Interesting, but pretty heavyweight...
Using RMagick - Imagemagick for Ruby
Rounded corners in CSS
Stardust at Home - Finally it's up and running, sweet! A really nice little AJAX interface as well.
New Media reach a larger audience with information on GIS and geospatial technologies.
Blast Maps
Sparklines graph library for Ruby
Sparklines now gemified
PlotKit - Javascript Chart Plotting
SVG::Graph
mrplot - Scientific plotting for Ruby
The Progress and the Promise of Microformats
Atom Protocol
sparklines for Ruby
Element.show - in Prototype.js
Gruff Graphs
installing Gruff Graphs
Sparklines in Wikipedia - An Edward Tufte invention, small little inline graphs.
sparkline.org
sparklines for minimalists
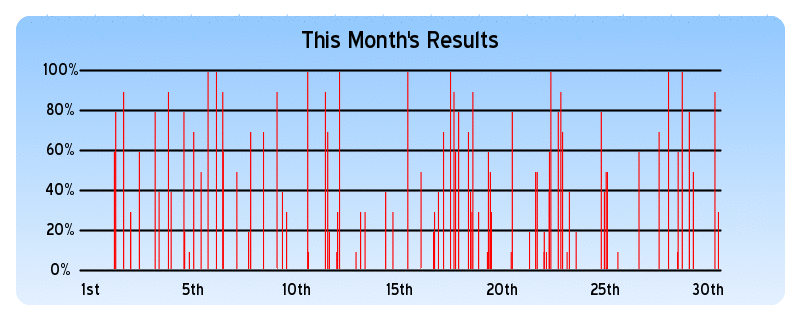
And it's so funny. After trying all those different graphing libraries, I just decided that none really did what I wanted so I just rolled my own with RMagick. Turned out to be quite simple, and I got exactly what I wanted, which was a graph with variably spaced impulses for each piece of data I wanted to display. Kind of like a scatterplot but with impulses. It conveys much more information than a bar graph, since I can show not only the score of each test, but also the time the test was done. Plus, the user can see exactly when tests were and weren't performed, which a bar graph just wouldn't show. Not just twice the information, but really the information squared. Tufte would be proud.
